September 13, 2018
Visualizing finances with Unreal Engine
“We wanted to view the business in a more interactive, visual manner,” says Commin. “Ideally, we could perform financial modeling calculations and view our business from a geographical standpoint, instantly and visually.”
Commin, an avid gamer, was spitballing ideas with colleague Brandon Hancock, the company’s IT supervisor, when he hit on the idea of using Unreal Engine to achieve this goal. The result was a proof of concept for an interactive real-time experience that incorporates geographical data, per-location statistics, and 3D models of present and possible future facilities, giving NRC’s management an engaging new way to manage their business.
Merging Geography and Finance
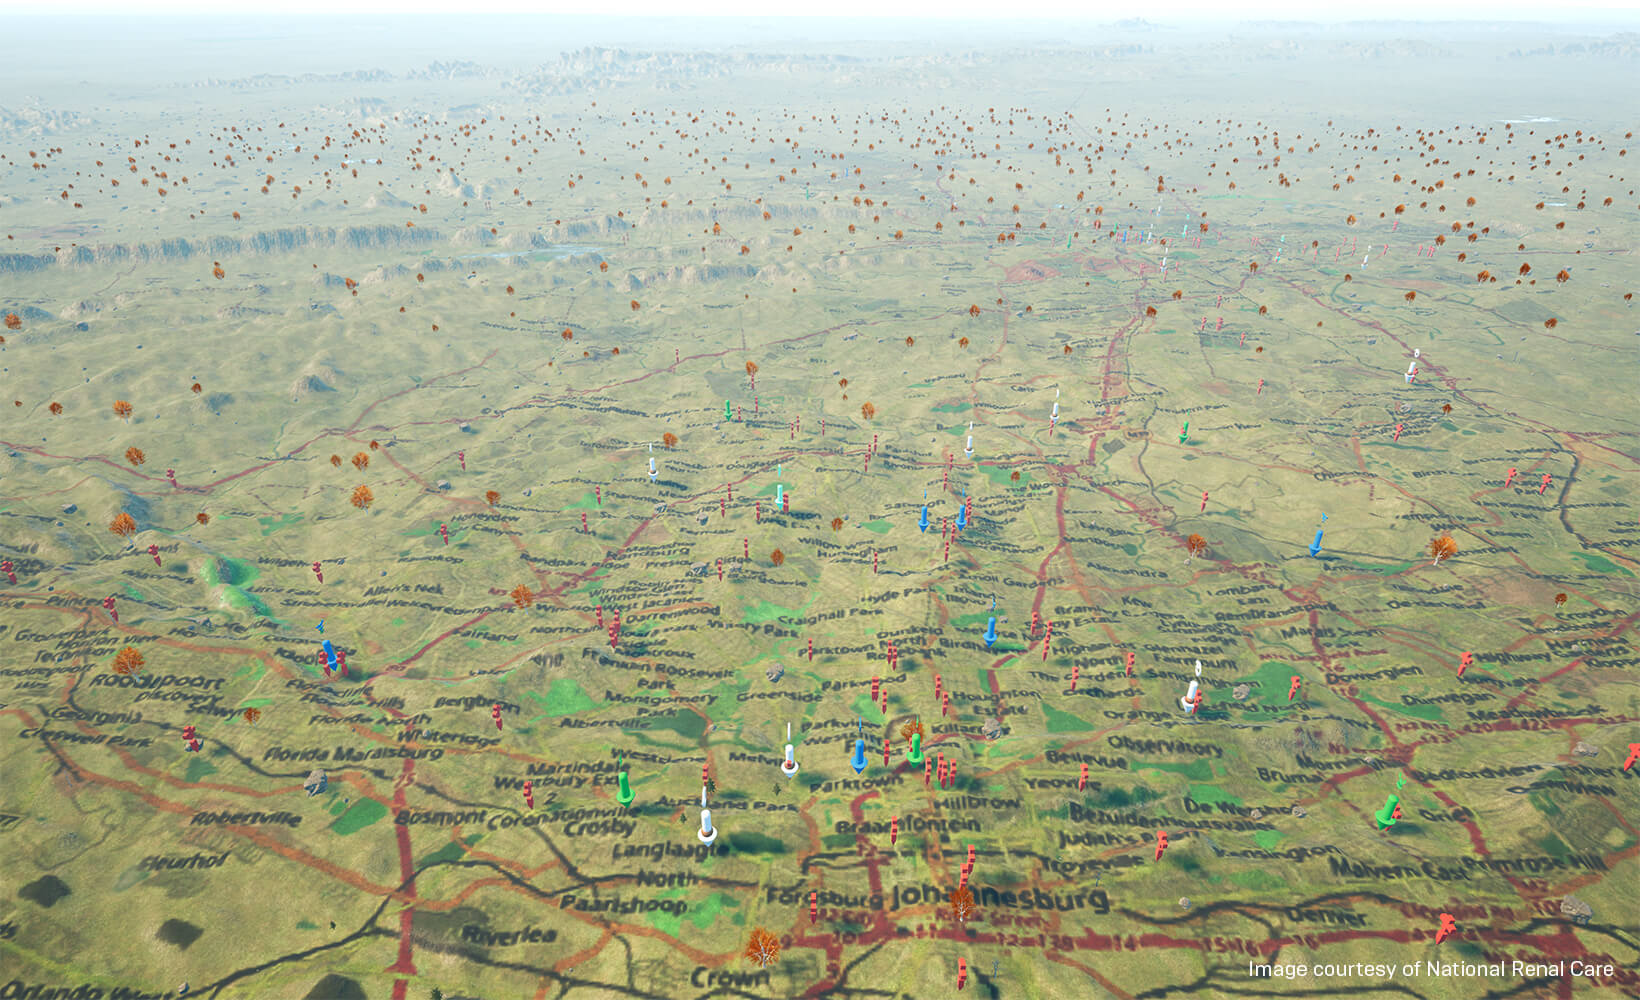
One of Commin’s goals was to visualize the geographical and financial relationships between renal care facilities in South Africa. Commin started by creating a map of South Africa in Unreal Engine, and then placed an icon for each renal care facility using GPS coordinates. While navigating the map, users can click an icon to reveal facility details such as address and market information. They can also zoom into an area to see a city’s topography and street layout.

Around each icon is a circular ring that encompasses the local South African municipality served by that facility, giving users the capability to explore geographical relationships between facilities. “In overlapping regions, the user can find further market intelligence like population statistics and renal prevalence,” says Commin. “This gives us the ability to visualize the competition between adjoining facilities in a way we never could before, and make faster and more informed decisions about where to invest our resources.”
Commin can also update the data anytime and see the results propagate to all the Blueprints. For questions that might arise during meetings, a user interface provides tools to obtain GPS coordinates for any location on the map, or calculate the straight-line distances between any two points.
Since they started using the map view to visualize their care facilities, Commin has been spared the task of explaining complex relationships between locations using numbers only. “We pop open the map view, zoom to an area to see the data and relationships, and geographical questions are answered,” he says.

Commin generated the map’s geometry in Unreal Engine using its terrain tools. For the landscape, he converted NASA’s Shuttle Radar Topography Mission (STRM) data to height maps and stitched them together. The map was textured using Substance and UE4 material assets, then overlaid with street maps created from OpenStreetMap.org.
Interactive Accounting
To create a flexible financial analysis tool, Commin designed a Blueprint to hold a standard facility cost/income statement. An Unreal Engine Blueprint serves as a container for scripts, actions, and events. For Commin, the Blueprint is structured to store and retrieve data on facilities’ financial and operational performance, supplier details, and per-item costing. “This is probably an unusual use for a Blueprint, but it fit the bill perfectly,” says Commin.
The Blueprint reads from Unreal Engine DataTables, which can be populated with real data from facilities, or with theoretical or projected data. “With this structure, we can run all kinds of studies,” says Commin. “We can populate with real data and compare supplier pricing, or write scripts that generate feasibility models to assess the impact of financial and operational decisions,” he says.
Architectural Visualization
To round out their use of Unreal Engine, Commin created 3D models of some of their facilities. The team uses these models to evaluate the layout of both existing and proposed facilities, with an added bonus - data can be attached to every item from electrical outlets to refrigerators. They will then be able review the number of any given item at a facility, compare expenses, and even project costs for a new facility.

Commin imported the 3D models from 3ds Max using Datasmith, one of the tools included with Unreal Engine. With models topping 3 million faces, efficiency of import was an important factor. “We tried importing with FBX and then with Datasmith, and the speed increased twofold,” says Commin.
The project was so successful that Commin used it as the basis for innovation in his presentation to become a finalist in Accountancy South Africa’s Top 35 Under 35 competition.
The Future of Game-Based Accounting
Commin foresees even more down the road for their innovative system. He is looking at incorporating live GPS data for company vehicles, and even for staff inside a facility, to provide invaluable time-in-motion data for assessing a facility’s overall performance.
“We could even push it to virtual reality,” says Commin. “Then management could view ghosted employees moving through a unit in real time.”
Commin expects that Datasmith will be key to achieving these goals. “As a team comprised of no one from a game development or architecture background, we’ve been able to produce a project that combines our careers with our passion for gaming,” Commin says. “Unreal Engine and Datasmith made that possible.”
Want to create your own unique real-time experience? Download Unreal Engine today.
