There’s a class of gameplay bugs that are hard to track down just via user reports. These types of bugs typically involve complicated steps where the AI has made a decision based upon the state of the game at the time. A user reporting an issue for a case like this can only report on the observable results. This makes tracking down issues related to specific gameplay state very difficult. UE4 has a tool to help in this regard; we call it Visual Logger. At its core, it is similar to the logging system you’ve seen before with the ability to capture state from the actor being logged and then display it visually in game or editor after the fact. This is a powerful tool that lets you see the gameplay state at the time of the issue coupled with the user’s report. By viewing that data, you can compare what you’d expect to happen to the data and underlying code.
To see the Visual Logger in action, use the menu in Windows | Developer Tools | Visual Logger. In versions prior to 4.7, use the console command "VisLog". Here's a session from StrategyGame. The first image shows the Visual Logger and the second image is from the viewport in the editor. Notice that there is a purple line indicating the selected AI's path and a red location marker at the selected point in the timeline.
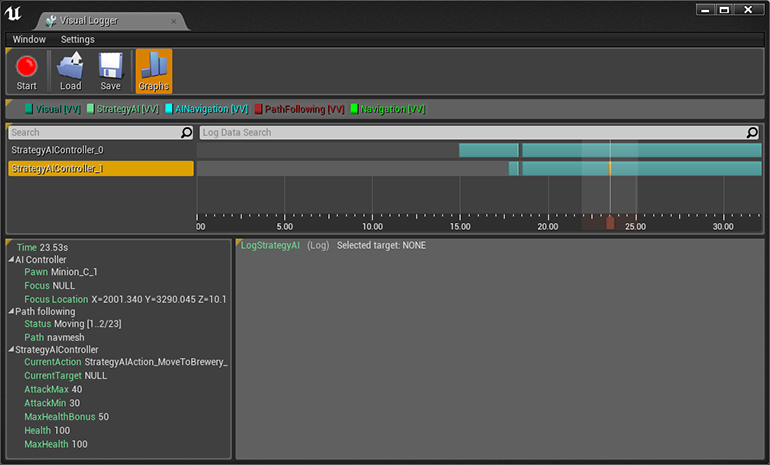
The Visual Logger in action.
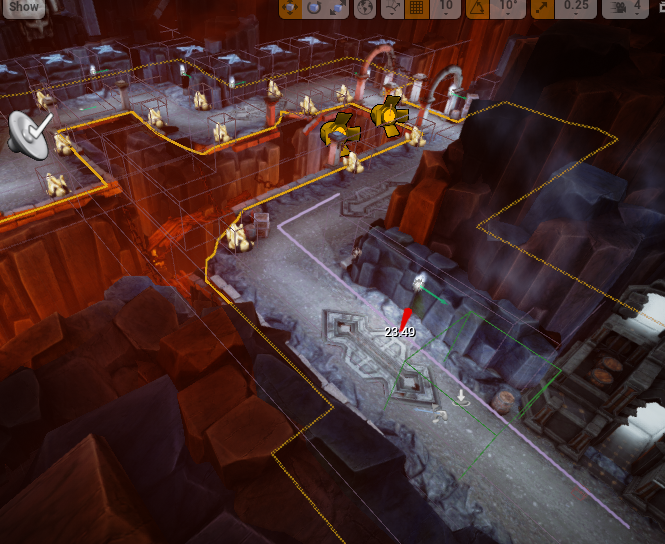
The level viewport in the editor showing the Visual Logger presenting information.
The highlighted area in the image below shows the list of Actors that have logged information to the Visual Logger during the recorded session. There's also a search bar to quickly find an Actor's log information by name.
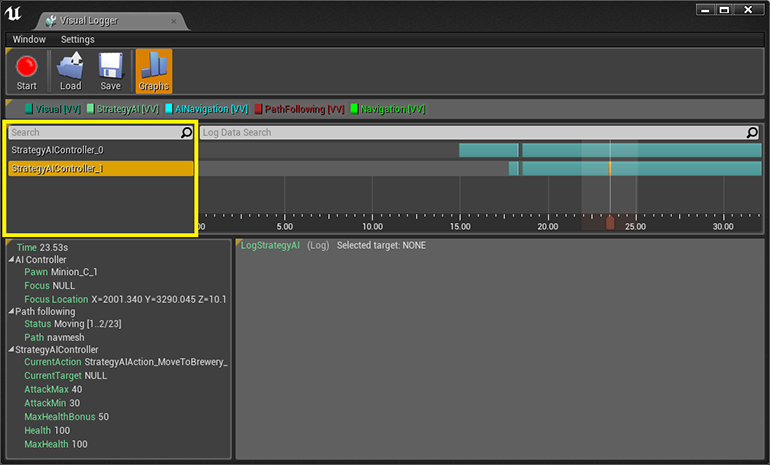
The Actor list and search option.
The next image highlights the timeline view. The scrubber in that image is at the 23.53 second mark. StrategyAIController_1 is selected so any information in the other areas are from that Actor at that time. The colored horizontal bars are logged events. The time bar can be scrubbed back and forth to update the other areas with a particular snapshot in time.
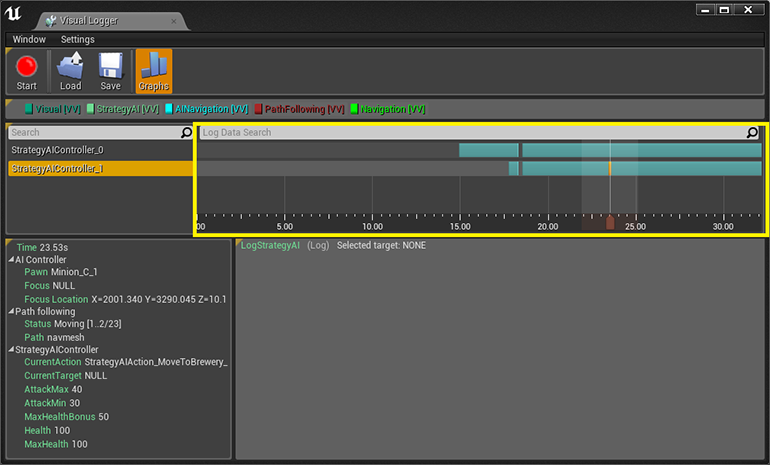
The timeline area.
In the highlighted portion in the lower left quadrant of the image below, the Visual Logger shows any snapshot data that was captured for that Actor at the time specified in the timeline. This data is captured once in a given frame that the Actor requests a visual log entry using the UE_VLOG() macro. Multiple visual logging calls in the same frame reuse the same data for that frame. The data captured as part of the snapshot can be categorized and customized for your game (a code example is provided below).
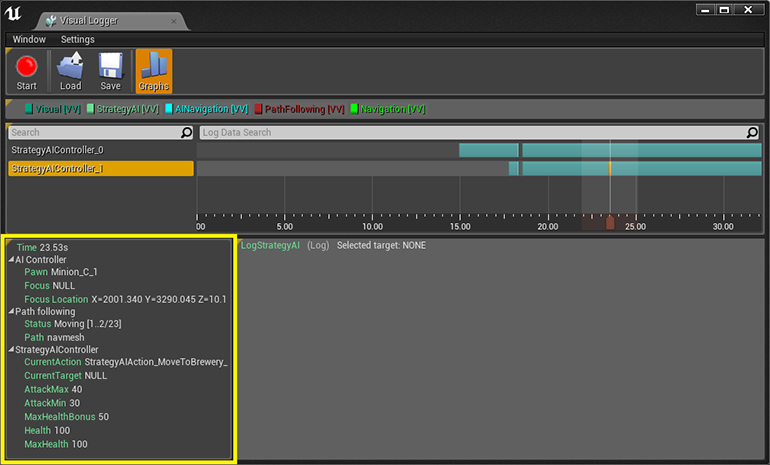
The Actor snapshot area with custom categories expanded.
The highlighted area in the image below surrounds the logging area of the Visual Logger. It shows the category the log was written to, plus the log message itself. If there are multiple log messages per frame, they'll show up as a list in that area.
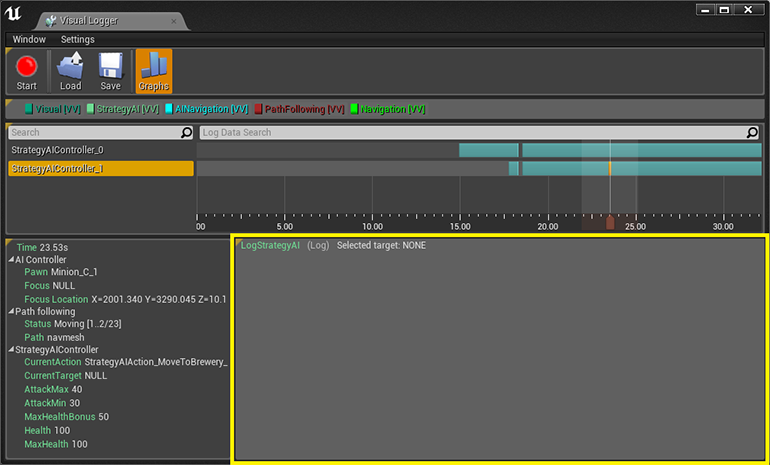
The log area where messages are displayed.
Now that you know what the major areas of the Visual Logger do, let's take a look at how to add support for it in your game. In the image below, the first person template was used to create a new project named GDC, which was used for a presentation at GDC. One function was added to capture state information about the Actor and one UE_VLOG() macro call was added to trigger the capture for Visual Logging.
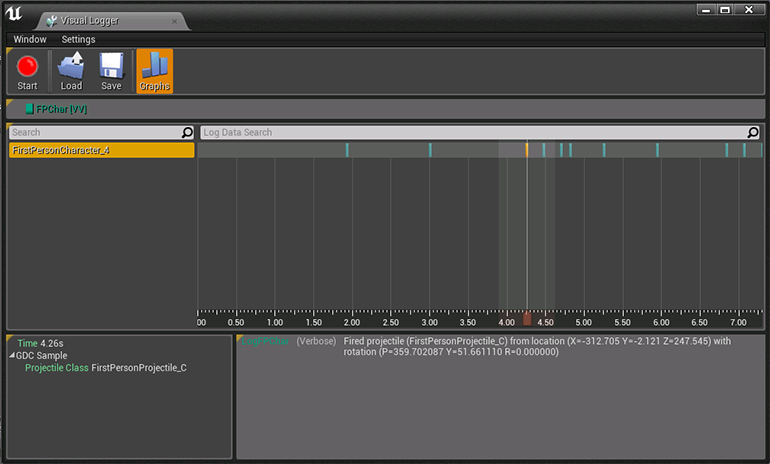
Visual Logger with example data.
In order to fill the snapshot area of the tool, you need to override one virtual function, GrabDebugSnapshot(). This function is implemented as part of Actor, so if you don't wish to provide custom information, you can skip this step. The Visual Logger can be compiled out depending on your build settings, so you must wrap the function declaration with the appropriate header. Below is the code added to GDCCharacter.h for the snapshot support:
#if ENABLE_VISUAL_LOG
    /** Appends information about this actor to the visual logger */
    virtual void GrabDebugSnapshot(FVisualLogEntry* Snapshot) const override;>
#endif
The implementation of this method, seen below, adds one category and one entry in that category. Again, this is wrapped within the proper #ifdef in case the build setting compiles out Visual Logger support. This code was added to GDCCharacter.cpp.
#if ENABLE_VISUAL_LOG
void AGDCCharacter::GrabDebugSnapshot(FVisualLogEntry* Snapshot) const
{
    Super::GrabDebugSnapshot(Snapshot);
    const int32 CatIndex = Snapshot->Status.AddZeroed();
    FVisualLogStatusCategory& PlaceableCategory = Snapshot->Status[CatIndex];
    PlaceableCategory.Category = TEXT("GDC Sample");
    PlaceableCategory.Add(TEXT("Projectile Class"), ProjectileClass != nullptr ? ProjectileClass->GetName() : TEXT("None"));
}
#endif
This function is only called once the Actor logs data to the Visual Logger. For example purposes, the firing of a projectile was logged so that it was easy to trigger and add to the 1st person template code. In the OnFire() function below, notice the UE_VLOG() macro usage. That is how you tell the Visual Logger that you want to capture data for an Actor. As stated previously, on the first use of that macro, the Visual Logger will make a call to GrabDebugSnapshot() to gather the data needed for display in the snapshot pane. The macro compiles out like any other UE_LOG() macro, so there's no need to wrap it in an #ifdef explicitly.
void AGDCCharacter::OnFire()
{
    // try and fire a projectile
    if (ProjectileClass != NULL)
    {
        const FRotator SpawnRotation = GetControlRotation();
        // MuzzleOffset is in camera space, so transform it to world space before offsetting from the character location to find the final muzzle position
        const FVector SpawnLocation = GetActorLocation() + SpawnRotation.RotateVector(GunOffset);
        UWorld* const World = GetWorld();
        if (World != NULL)
        {
            // spawn the projectile at the muzzle
            World->SpawnActor(ProjectileClass, SpawnLocation, SpawnRotation)
            UE_VLOG(this, LogFPChar, Verbose, TEXT("Fired projectile (%s) from location (%s) with rotation (%s)"),
                *ProjectileClass->GetName(),
                *SpawnLocation.ToString(),
                *SpawnRotation.ToString());
        }
    }

    // try and play the sound if specified
    if (FireSound != NULL)
    {
        UGameplayStatics::PlaySoundAtLocation(this, FireSound, GetActorLocation());
    }

    // try and play a firing animation if specified

    if(FireAnimation != NULL)
    {
        // Get the animation object for the arms mesh
        UAnimInstance* AnimInstance = Mesh1P->GetAnimInstance();
        if(AnimInstance != NULL)
        {
            AnimInstance->Montage_Play(FireAnimation, 1.f);
        }
    }
}
Not only can you log text information, you can log visual shape information like you saw in the StrategyGame level viewport earlier. This is a powerful feature because it helps you visualize what is going on in the game. Here's an image showing the different types of shapes that can be visually logged.
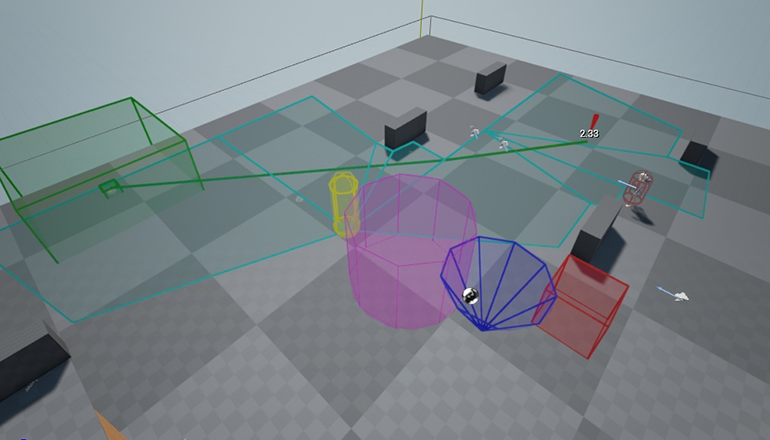
Path information, cylinder, cone, capsule, box example shapes.
The following macros provide support for logging shapes.
- UE_VLOG_SEGMENT
- UE_VLOG_LOCATION
- UE_VLOG_BOX (axis aligned box)
- UE_VLOG_OBOX (oriented box)
- UE_VLOG_CONE
- UE_VLOG_CYLINDER
- UE_VLOG_CAPSULE
Each of these macros requires different parameters to record the shape information. You can find the macros in VisualLogger.h to see what each one needs for logging.
One last thing to mention about the Visual Logger is that you can save these files to disk for later debugging sessions. If you have your QA team always record these sessions, they can then attach them to any defect tracking entry that they create. Then you can load the corresponding level and the Visual Logger file to see what happened. This tool should help speed up your debugging efforts tremendously.