How to improve game thread CPU performance in Unreal Engine
Is the frame rate in your game low? Do you know why? Could it be because you have too many enemies spawned at once or is it because one specific enemy is expensive? Could it be because you have a ton of visual effects or because of that sweet skill system you wrote?
Relax and don’t jump to conclusions!
The first step when attempting to fix any performance problem is to gather information so that you can make an informed decision as to how to proceed. It is very natural for someone to say something like “Of course it’s slow! This level has 100,000 actors!”, but without properly gathering data you may spend a lot of time reducing the number of actors in your level instead of addressing the real performance problem which could have been completely unrelated and much easier to fix.
Got it! Where do I start?
The first piece of data you want to collect is if your bottleneck is located in the game thread, in the rendering (Draw) thread, or on the GPU. To determine this, launch your game in a non-debug build and enter the console command “stat unit” to display how much time is spent doing what.

Your Frame time is the total amount of time spent generating one frame of the game. Since both the Game and Draw threads sync up before finishing a frame, the Frame time is often close to time in one of these threads. GPU time measures how long the video card takes to render the scene. Since GPU time is synced to the frame, it will likely be a similar number as the Frame time as well.
If Frame time is very close to the Game time, you are bottlenecked by the game thread. If Frame time is very close to Draw time, you are bottlenecked by the rendering thread. If neither time is close while GPU time is close, then you are bottlenecked by the video card.
In this article, we will only be talking about how to address problems in the game thread.
Aha! Now I know that I am bottlenecked by the game thread. What now?
Your best tool for looking at game thread performance is taking a stat profile. You can start a profile by entering “stat startfile” in the console, which can be opened by pressing the tilde (~) key. Let it run for at least ten seconds or so to get a nice average over many frames. Longer profiles are good too and can be used to detect long intermittent issues, but taking a profile longer than thirty minutes is not suggested since the file will be very large. Once you have a good sample of time, you can enter “stat stopfile” to end the profile. A ue4stats file will be written your project’s folder under the path Saved/Profiling/UnrealStats.
Alright, I took a profile. How do I open it?
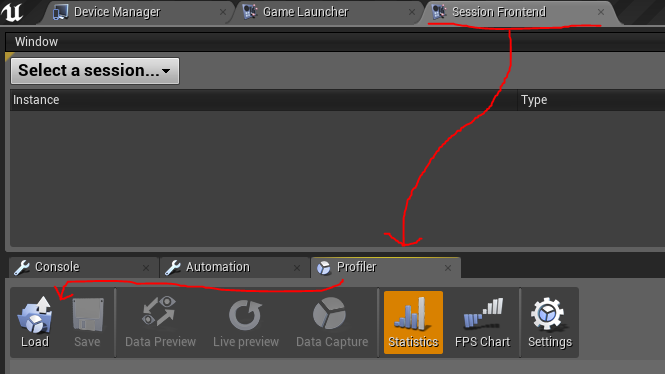
To open your captured profile, you must use UnrealFrontend, which can be found in the same folder as UE4Editor, or open the Session Frontend tab in the editor found in the Window menu. Once you have the Session Frontend tab open, you will need to switch to the Profiler minor tab. From there, you can choose to load the ue4stats profile you recently captured.
I’ve got the profile open, so what am I looking for?
The important information is in the function tree down at the bottom. Expand the GameThread item and drill down until you see an entry where the “Inc Time” (Inclusive Time) is more than a couple milliseconds and doesn’t contain many, or any, children. Also take note of the “Calls” column, which shows you the average number of times that stat was called every frame. Don’t be fooled by “CPU Stall” items. Those just show you how much time the thread spent waiting for something else, so they don’t count and only show up if the frame rate is limited or the game thread is not the bottleneck. In the profile depicted below, there seems to be a suspicious amount of time caching fonts.
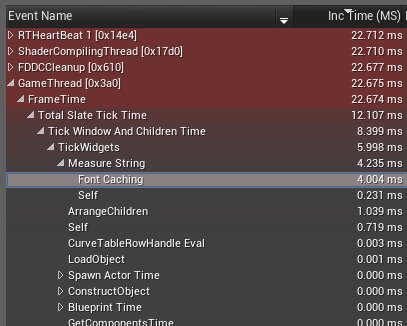
This was a real issue found in Fortnite just this week! In this case, we were displaying a lot of text that changed size based on distance between the camera and important game objects. Because we were resizing the text on every frame, the font cache in Slate, Unreal Engine’s UI system, was filling up with the same string at hundreds of sizes. The fix was to stop scaling text dynamically based on distance, although discretely changing text size at certain distance thresholds would have also worked.
That’s great for Fortnite, but my problem isn’t “Font Caching”.
There are a number of usual suspects to watch out for.
An important item is FTickFunctionTask. Under this item is every actor and component that is ticking. Reducing the number of actors and components that tick every frame is often a great way to speed up the game.

If there are actors in your game that should never tick and you are using C++ code, you can put this in the actor’s constructor to prevent it from ticking entirely:
PrimaryActorTick.bCanEverTick = false;
If the actor only ticks for some of the time, you can put this in the constructor instead:
PrimaryActorTick.bCanEverTick = true;
PrimaryActorTick.bStartWithTickEnabled = false;
Then you can enable and disable ticking using the SetActorTickEnabled function.
Another thing to keep track of is the BlueprintTime. The best way to find this one is to switch to inclusive (coalesced) view and locate it in the list. This will combine all BlueprintTime entries into a single line. If you select BlueprintTime then switch back to Hierarchical view, it will select all the places where Blueprint code was executed, which will give you a pretty good idea of where the time was spent and in what Blueprints.

Another common offender is TickWidgets. If this stat is high, it indicates that you either have too many widgets displayed at once or the delegates for attributes on these widgets are too complex. Some slate attributes, such as visibility, may get called several times per frame, so they should be small and return in a timely manner.
Have a lot of Skeletal Meshes in your game? SkinnedMeshComp Tick time can sometimes get expensive. Consider reducing the number of bones of the Skeletons that show up in the profile or reduce the complexity of their Anim Blueprints. If you do not need the animation to update when you can’t see the Skeletal Mesh, consider setting the MeshComponentUpdateFlag property on the Skeletal Mesh component to OnlyTickPoseWhenRendered. Be careful when setting this flag as AnimNotifies will no longer be fired for these meshes when they are not rendered.
Actually, I am looking for what is causing hitches every once in a while.
The best way to do this is to find a spike in the timeline, select the frames around it and change the view to “Maximum” instead of “Average”. This will change all the numbers to show the peak value in the selected frame range instead of the average value.

Thanks!
Using the Profiler is critical to overall game performance and can save you a bunch of pain by avoiding assumptions about the true problem. For more information about all the features in the Profiler, visit its documentation page. https://docs.unrealengine.com/latest/INT/Engine/Performance/Profiler/index.html